Project Overview
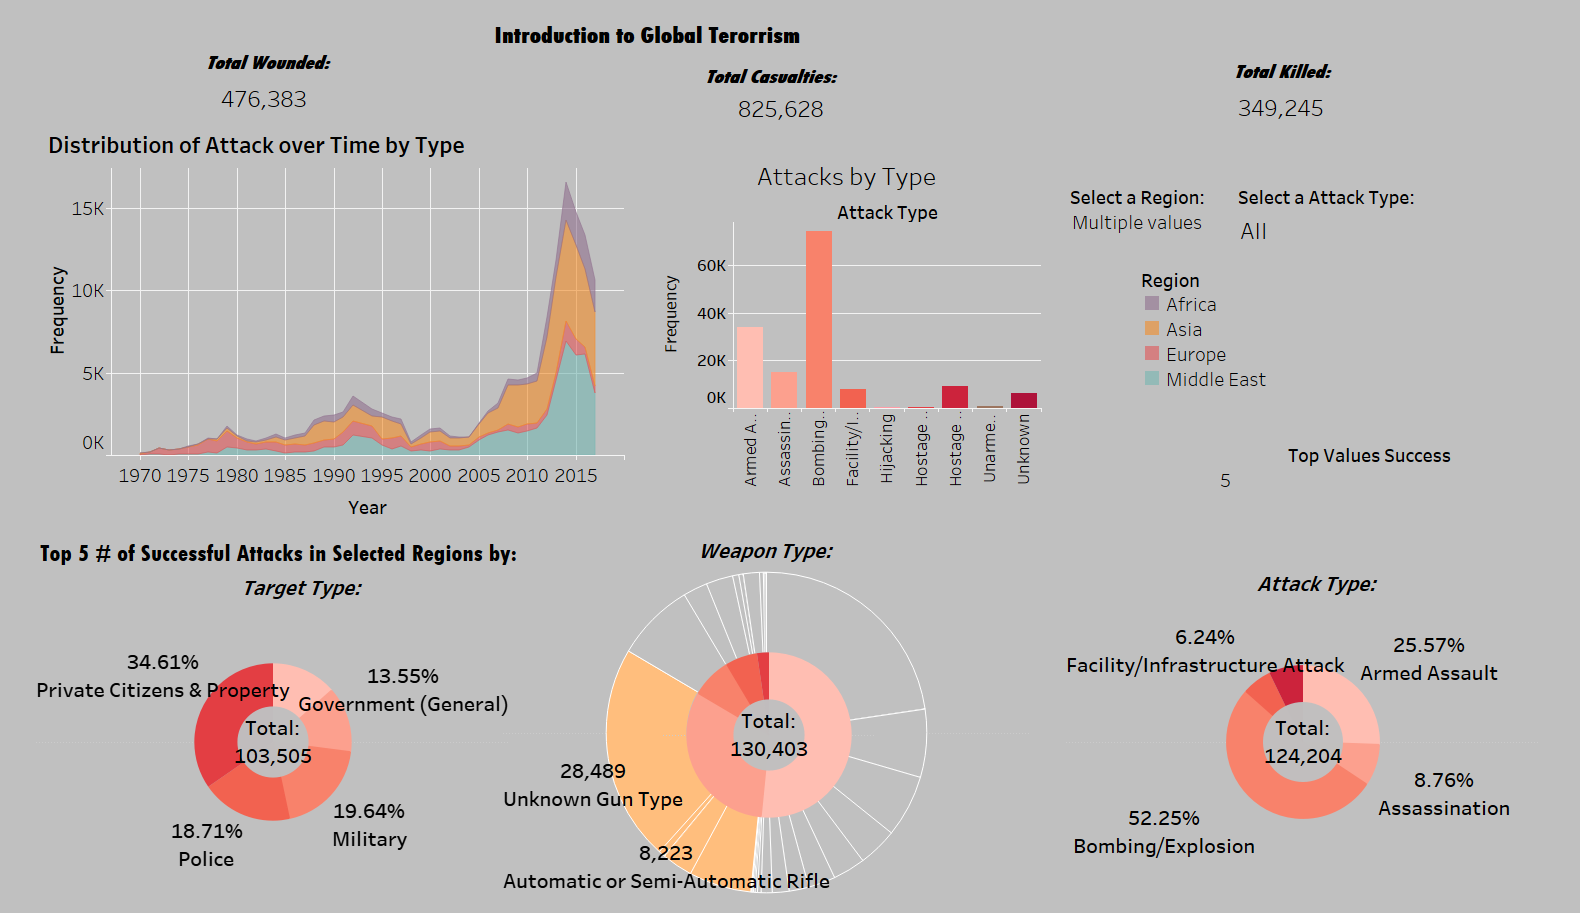
This project focused on developing an interactive dashboard to provide insights into global terrorism trends, specifically examining the impact and scale of various attacks. The dashboard offers users a clear understanding of the frequency, intensity, and geographical distribution of these events.
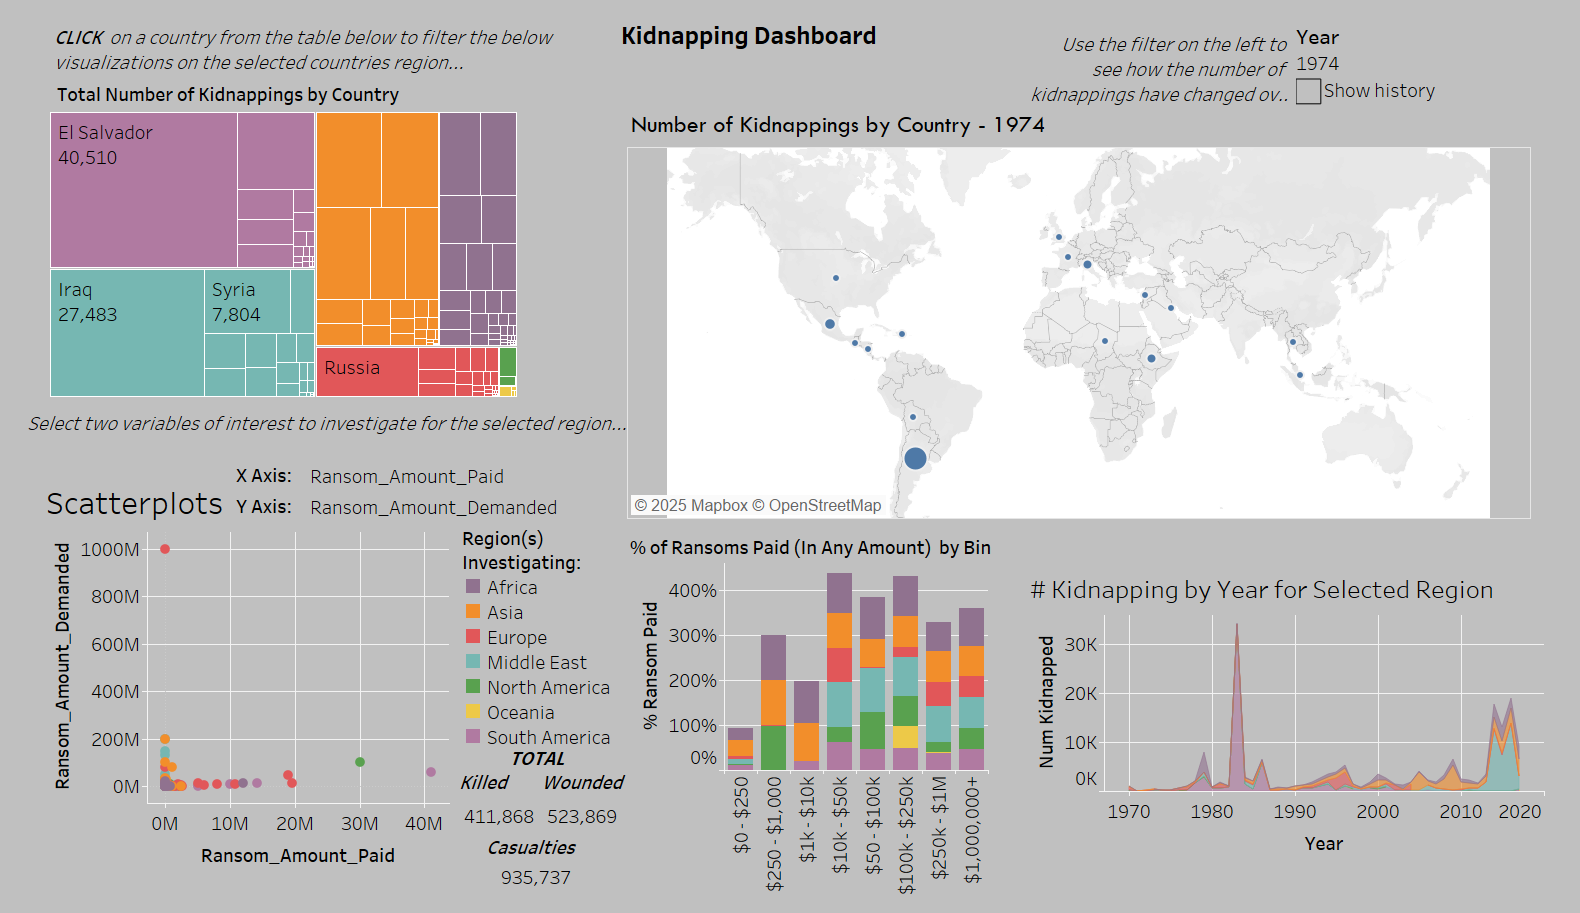
Additionally, a dedicated dashboard was created to analyze the global impact of kidnappings, with a detailed breakdown by region. Key Performance Indicators (KPIs) used in the dashboards include:
- Number of individuals wounded
- Number of individuals killed
- Total casualties
- Ransom amount demanded
- Ransom amount paid
These dashboards empower users to explore and interpret the data through a visually compelling and user-friendly interface, supporting data-driven decision-making and strategic planning.
Technologies Used
Tableau Dashboard
Interested in exploring the full interactive dashboard? Please reach out via email for a copy.
Visualizations